The dataset for this project integrates records from three major sources: the Schoenberg Database of Manuscripts (241,000 records, representing 195,000 unique manuscript histories), the Bibale Database (13,000 records curated by the Institute for Research and History of Texts, France) and the Medieval Manuscripts Catalogue from the Bodleian Libraries (12,000 records from the University of Oxford). These datasets are unified within the Mapping Manuscript Migrations (MMM) knowledge graph, which uses SPARQL queries to retrieve data on manuscript IDs, locations, ownership history and physical attributes. The knowledge graph employs ontologies like Erlangen CIDOC-CRM (events), FRBRoo (bibliographic information) and the Getty Thesaurus of Geographic Names (locations) for semantic integration. The dataset is static, in tabular format (data.frame) with 494,271 rows and 14 columns, including manuscript IDs, provenance data, locations, ownership timelines, physical attributes and metadata like language and author names. Key challenges include significant missing values (e.g. manuscript dimensions, author names and languages) and inconsistencies arising from varying record-keeping practices across databases. The data will be imported into R using the readr package for cleaning and analysis, leveraging tools like dplyr and tidyr for transformation.
The following objects are masked from 'package:stats':

    filter, lag
The following objects are masked from 'package:base':

    intersect, setdiff, setequal, union
Code
library(tidyr)library(janitor)
Attaching package: 'janitor'
The following objects are masked from 'package:stats':

    chisq.test, fisher.test
Code
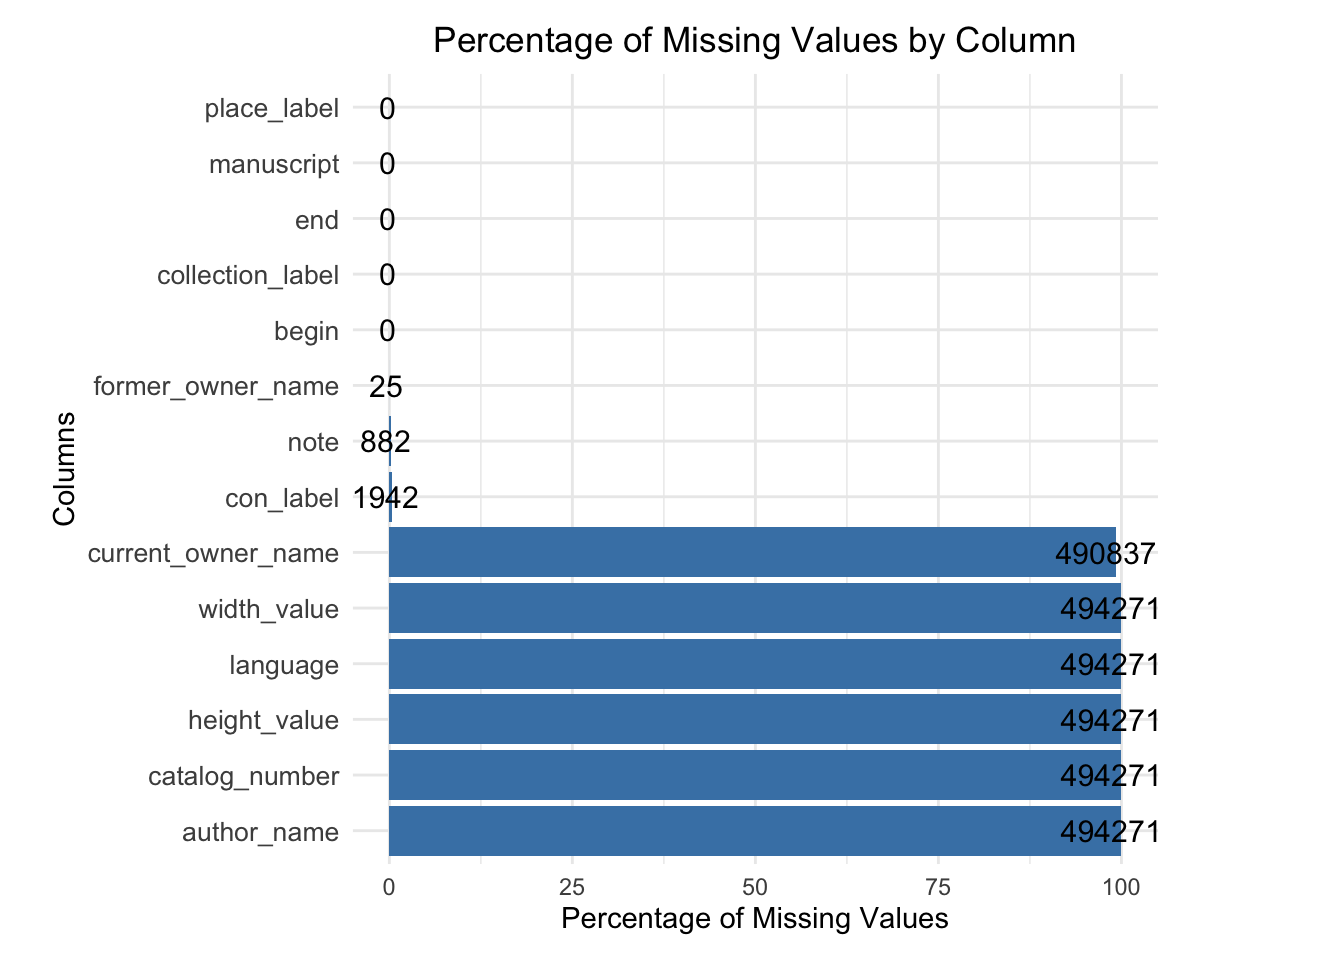
data <-read.csv("/Users/abhitay/final_extracted.csv")# Cleaning the datasetdata <-clean_names(data)data <- data |>mutate(across(everything(), as.character))data <- data |>mutate(across(everything(), ~na_if(.x, "")))# Calculating the missing valuesmissing_summary <- data |>summarise(across(everything(), ~sum(is.na(.)))) |>pivot_longer(cols =everything(), names_to ="Column", values_to ="Missing_Count") |>mutate(Percentage = (Missing_Count /nrow(data)) *100)# Bar Plotggplot(missing_summary, aes(x =reorder(Column, -Percentage), y = Percentage)) +geom_bar(stat ="identity", fill ="steelblue") +geom_text(aes(label = Missing_Count), hjust =0.6, size =4, color ="black" ) +coord_flip() +labs(title ="Percentage of Missing Values by Column",x ="Columns",y ="Percentage of Missing Values" ) +theme_minimal() +theme(plot.title =element_text(hjust =0.5),axis.text.y =element_text(size =10), plot.margin =margin(t =10, r =70, b =10, l =20) )
The plot reveals key insights into the completeness of the dataset, with critical columns such as place_label, manuscript, end, and collection_label having no missing values, ensuring a solid foundation for analyzing manuscript locations and timelines. However, moderate gaps in former_owner_name, note, and con_label, indicate incomplete provenance records that may limit the depth of historical analysis. Manuscript attributes such as width_value, height_value, language, and author_name exhibit significant missing rates of 100%, reflecting gaps in data availability. These patterns underscore the importance of addressing missing data, either through imputation or exclusion, to maintain analytical integrity while highlighting opportunities for enhancing future data digitization and preservation efforts.